Cetelem is a subsidiary of BNP Paribas Personal Finance, specialized in consumer credits. Cetelem provides responsible financial solutions for individuals, such as personal loans, credit cards, and instalment loans. Cetelem has a unique customer-centric approach, and uses modern technological solutions to serve its customers. They play a dominant role in the Hungarian market.
To understand the role of each communication channel in the various stages of the customer journey and to have a clear view of the different journeys customers make before making an online personal loan application. We also wanted to validate some hypotheses regarding customer behaviour with facts and data.
Moving away from last click attribution and campaign efficiency, we wanted to build a 360-degree customer view and thus proposed a journey-based campaign measurement and efficiency analysis, with an extended attribution analysis as a first step.
Since Cetelem does not have a Google Analytics (GA) 360 account, we proposed a solution – bearing in mind the account’s limitations – where we did not rely solely on GA reports and settings but used some offline mapping tools, as well. We started the analysis with a Google Analytics measurement audit to map the potential gaps/ limitations of the settings (if any), that could affect the outcome of our analysis.
After the audit, we worked with Assisted Conversions and Top Conversion Paths reports, custom segments and some advanced settings to export data and be able to analyse them outside of GA. Thanks to data exports and offline analysis, and with the help of our data analysts we were able to map the tables, aggregate and visualize the data in a way that helped us identify deeper relations/correlations between channels and conversions.
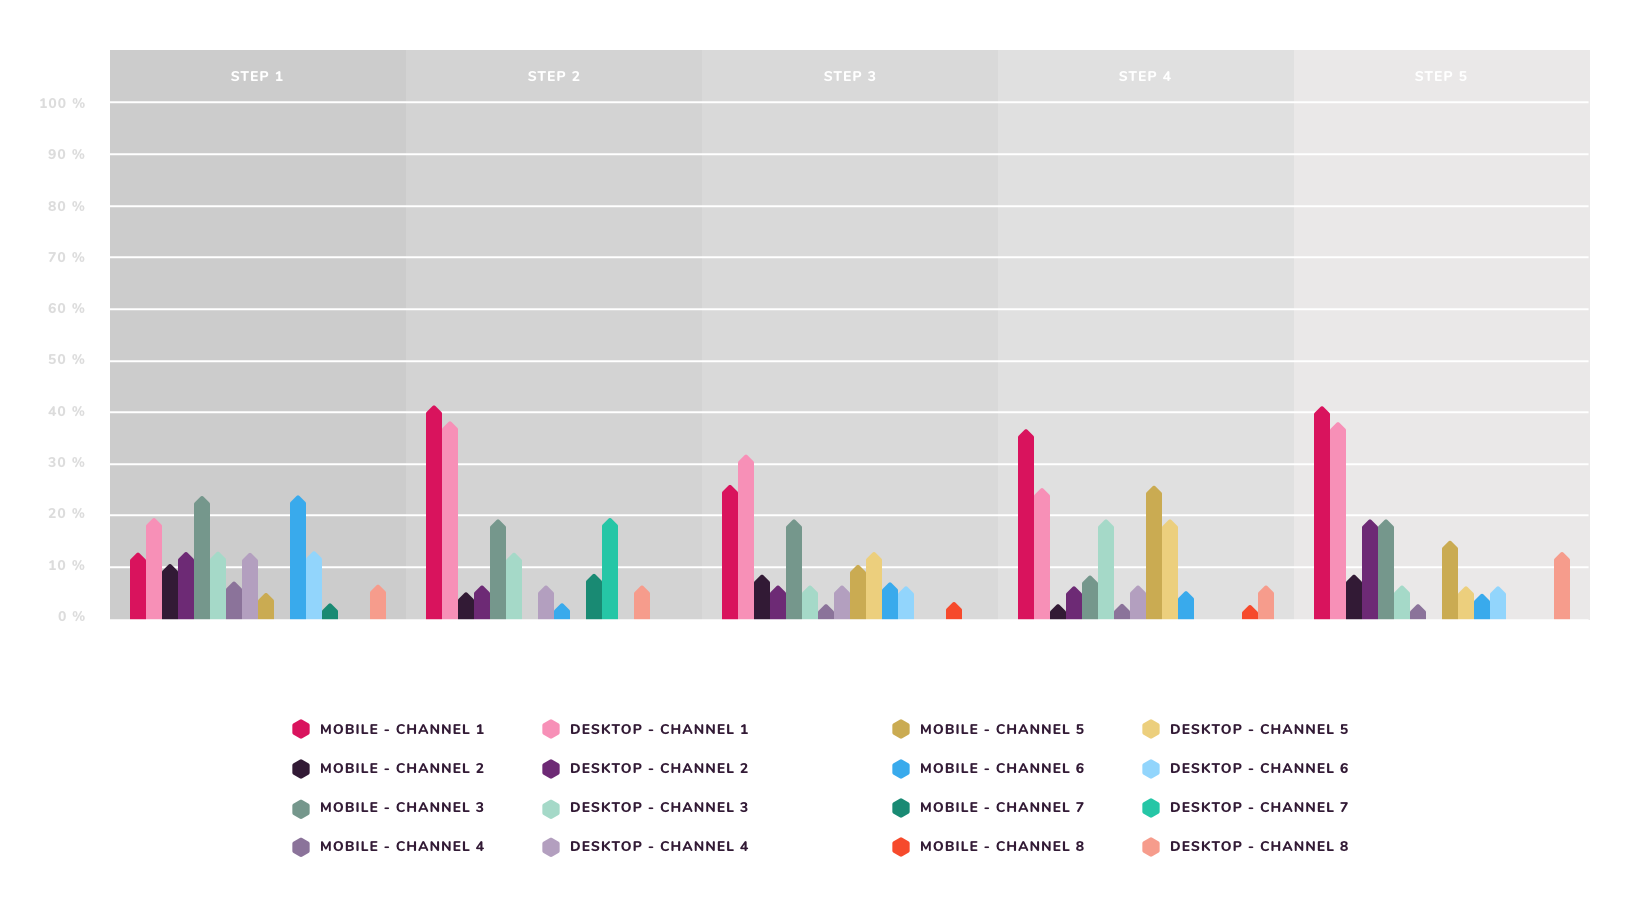
The following analyses were prepared with custom channel grouping to define the role of the channels in each step of the customer journey:
Conversion path analysis – we worked with GA export, and after text parsing we divided the journeys into steps to analyse them. We checked which parameters of the journey affect the conversion the most. (Analysis of one and multi-step journeys from different angles such as loan application types, credit risk, the goal of the loan application and duration.)
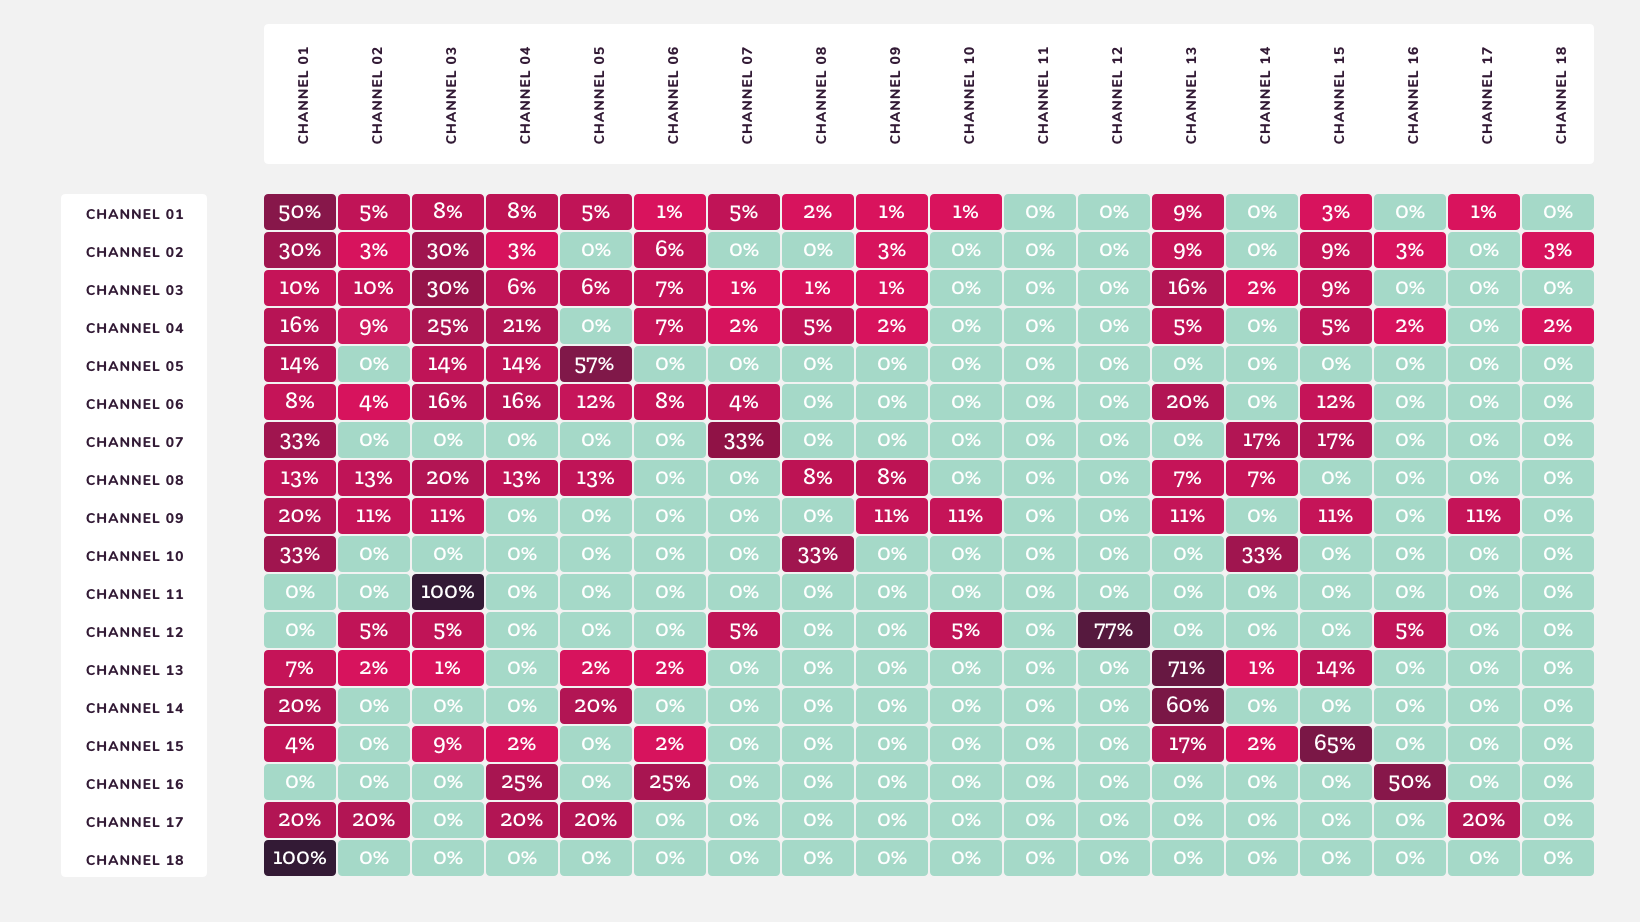
Typical channel switches analysis – from the divided journey steps we created a heat map where we could see the most common channel switches based on device or customer type.
Attribution model comparison – to detect which channels have the highest impact on conversions at various stages of the journey and to check if there are any channels over or undervalued. GA only supports these models in an aggregated view, while we were able to examine a number of combinations of data from journeys divided into steps along the dimensions mentioned above to draw the final lessons.
We are convinced that campaign spending should not be re-weighted based on one single analysis. Instead, after implementing the new custom attribution model and the missing tracking methods in GA we should analyse another period with similar depth analysis so that we have enough data to be able to improve campaign spending through a better understanding of conversion pathways.
The campaign journey-based efficiency analysis is just the first step towards our long-term goal to connect all campaign clicks of a user with the onsite loan application journey and the offline loan placement process, in order to get a 360-degree customer view.
Dóra Hornyák
Head of Marketing Communication – Cetelem
PPC, media, programmatic, SEO, CRO, analytics, research
‣
Read more
We are always looking for talented people, even when we don’t have job openings in your area of expertise.
‣
A kosárlabda csapatok 5 fős felállásban játszanak. A nevezett csapatokat csoportokba osztjuk, a sorsolást a tornát megelőző héten minden csapat részére kiküldjük. A mérkőzéseket hivatalos játékvezető vezeti. A mérkőzések egy pályán zajlanak. A csoportok első két helyezettje az egyenes kieséses szakaszba kvalifikálja magát. Az egyenes kiesés szakaszban a csoportmérkőzések során első helyezett csapatok a másik csoport második helyezettjével játszanak, ezt követően a vesztesek a harmadik helyért mérkőznek meg egymással, majd a győztesek vívják a döntőt.
Csapatlétszám: 5+1 fő.
Játékidő: 2×10 perc (szünet nélkül térfélcserével)
A mérkőzéseket 3×2 méteres kapukra játsszuk.
Page speed has become an important factor for website owners and SEOs since Google began focusing more and more on user experience factors. If companies don’t adapt to this new mindset, they will lose their organic power.
Nokia has experienced an extensive page load time on most of its pages, but lacked proper measurable information about the performance of the website. It is challenging to adapt site-wise technical modifications without understanding what is really behind the curtain.
Mito introduced a multifactor, multi locational-targeting page speed measurement and reporting system across different devices.
Our focus was to develop a measurement system from scratch that is able to report on different page speed KPIs so we can better understand what additional analyses are needed to increase the pages’ performance. We did not only focus on a page level measurement, but also grouped pages to page types that assists us in making more educated assumptions.
We paid attention to location modularity in order to extend the number of analysed locations to additional countries by adding new Virtual Machines to our framework.
We are able to measure different KPIs on both mobile and desktop so we can see how the site performance is realized across devices.
Our measurement system and dashboard provided us insights on what type of elements of the different page types might cause low speed performance and it helped us to further analyse the loading curve, just as the opportunities in Google PageSpeed Insights recommendations for the different page types.
We set up the measurement system and the dashboard that reports on website performance and opportunities.
Through properly tracking the page speed improvements, Nokia becomes a more powerful organic participant in the telco market in Google search, while they provide a better user experience for their visitors.
An international business of this size requires a comprehensive measurement strategy including responsible data collection, consistent management of tags and measurement codes, personalized website tracking and purposeful conversion rate optimization (CRO).
We kicked off Analytics projects from January, 2020, beginning with extensive Google Tag Manager and Google Analytics audits. Besides inspecting the different system settings, we also optimized the measurement and pixel implementation processes within Nokia in order to increase efficiency and reduce implementation periods.
After the key adjustments and process harmonization, we have moved forward and started to work on the website and landing pages’ efficiency, including several conversion rate optimization tasks such as heatmap analysis and A/B testing.
Nokia is receiving continuous support from our analytics team to ensure the client’s measurement and data is reliable. Due to streamlined processes, implementation periods are shorter and we eliminated unnecessary website tracking codes which cause longer loading times.
Nokia launched a digital campaign to educate the market that their industrial-focused LTE solutions are the key in accelerating the ultimate benefits of digital transformation and realization of the fourth industrial revolution.
The goal: to build brand awareness and create demand for Nokia private Industrial Wireless solutions in new vertical markets, especially infrastructure or asset-heavy industries where digitization has been mostly restricted to point solutions without general network connectivity.
We’ve developed a multi-touch global digital media campaign, which covered the entire user journey of business leaders, from education to making a business decision.
Our main goal was to make Nokia visible on a large scale through automated solutions and smart targeting to reach people when they are reading, talking, learning about or searching for private wireless networks.
To archive this, we’ve utilized the combination of digital media platforms, including industry specific content sponsorships, social media ads, paid search, programmatic hyperlocal and Digital out-of-home ads in front of target company HQs. We’ve made sure that when our key audience is browsing the web, using social media on their phones or just walking outside of their offices, they see a relevant Nokia ad.
The campaign has reached over 80 000 business decision makers and influencers in 3500 target companies, across 5 industry verticals globally.
Private wireless solution specific brand search volume increased by 70% during the campaign period (YoY). In Q2 and Q3 2020, Nokia Enterprise had a double digit year-on-year growth in net sales and new customers.